
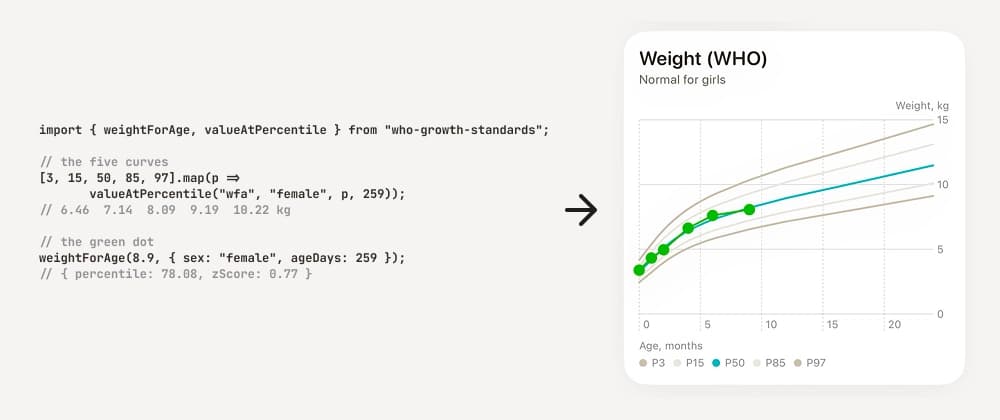
Every baby tracker shows growth percentiles. "Your daughter is in the 72nd percentile for weight." It looks like a lookup — find the row for her age, compare, print a number.
It isn't. And the ways it goes wrong are interesting enough to be worth writing down.
I ended up implementing this properly for a baby journal app, and published the result as who-growth-standards — MIT, zero dependencies, all the WHO tables bundled. This post is the reasoning behind it.
The WHO Child Growth Standards don't publish percentiles directly. They publish three numbers per age per sex: L, M and S. M is the median — the 50th percentile value. S is the coefficient of variation. L is a Box-Cox power that handles skew.
That last one exists because growth data isn't normally distributed. A 3-month-old can weigh twice the median; none can weigh half of it and survive. The distribution has a long right tail, and L is what stretches the scale to make it symmetric.
This isn't hypothetical. Across the WHO tables, L values drift with age and cross or approach zero in several indicators. Head-circumference-for-age publishes L = 1 exactly at birth; BMI-for-age starts negative and moves through zero territory as children grow.
Miss this branch and you get Infinity or NaN for real children at real ages — usually silently, because nobody validates a percentile that came back as NaN until a parent screenshots it.
There's a related trap I hit while writing tests. My first test asserted continuity: that as L approaches zero, the power form converges to the logarithmic one. It failed at L = 1e-12.
That's not a bug in the maths — it's catastrophic cancellation. (X/M)^L for tiny L is 1 + L·ln(X/M) + …, a number extremely close to 1. Subtracting 1 destroys most of the significant digits, and the smaller L gets, the worse the result. Agreement is best around 1e-6 and degrades below 1e-8.
The test now says so explicitly, because the naive version of that assertion looks correct and fails for reasons that take an hour to understand:
The WHO publishes these as Excel files, one per indicator per sex, at cdn.who.int. Six indicators × two sexes = twelve files, roughly 17 000 rows of LMS triples in total.
I've seen implementations that hardcode a dozen anchor points and interpolate between them. That's how you end up several percentiles off in the middle of the range — invisible in testing, wrong in production.
The right move is to bundle all of it, and to generate rather than hand-copy. My repo has a script that downloads the source files and emits typed TypeScript modules:
Two practical notes. First, the URL patterns are inconsistent — some indicators live under expanded-tables, one under expandable-tables, and one file is -table.xlsx while its sibling is -tables.xlsx. Finding them took longer than parsing them.
Second: generated data files should be reproducible. Re-running my generator produces byte-identical output, which means the tables in the repo are verifiably the WHO's numbers and not something that drifted through a manual edit three commits ago.
Age-based indicators come at daily resolution — 1857 rows covering 0 to 1856 days, the full 0–5 years. Weight-for-length and weight-for-height are indexed by centimetres in 0.1 cm steps.
With daily tables you might think interpolation is unnecessary. It isn't — real applications pass fractional values.
A measurement taken at 100.5 days. A length of 74.35 cm. Whether you floor, round, or interpolate changes the answer, and the difference is largest exactly where the curve is steepest — the first weeks of life, which is when parents check most obsessively.