
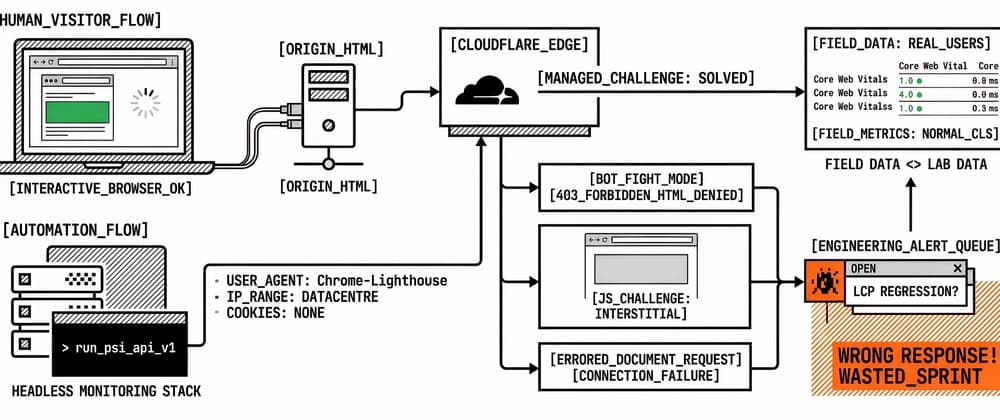
The same client URL opened in PageSpeed Insights from a laptop often completes. Put that URL on a schedule, call the PageSpeed Insights API from a monitoring stack, or re-run Lighthouse through a headless pipeline, and the document request returns a Cloudflare challenge, a 403, or an empty error shell. The score that ends up in the ticket is not a Core Web Vitals regression. It is a security edge deciding that automation is not a visitor worth serving HTML.
That contrast is the whole problem for agencies. Manual checks feel fine, so the account team trusts the green screenshot. Overnight automation red-flags the homepage, clients ask what broke, and engineering digs into LCP subparts on a page that never reached the real document. Cloudflare is doing its job. Monitoring is measuring the wrong response. What follows is how to tell those cases apart, which Cloudflare controls usually cause them, and how to allow legitimate PageSpeed Insights traffic without opening the site to every scraper on the internet.
For the wider network path (DNS, TLS, CDN cache), see Network Performance for Web Teams: DNS, TLS, HTTP, CDN, and Cache Rules. That guide covers where edge routing and cache hits change Time to First Byte before paint work begins. For why one-off PageSpeed Insights runs are a weak substitute for a schedule, see PageSpeed Insights vs Automated Monitoring: When Manual Checks Aren't Enough.
PageSpeed Insights and Lighthouse need a full HTML document, then a rendered page, to compute lab metrics. An interactive browser session often looks enough like a human visitor for Cloudflare to pass the first request, especially if cookies from a prior challenge exist, JavaScript challenges can run, or the operator is on a residential network that is not already associated with bulk scraping. Scheduled and API-driven runs typically do not share that context. They arrive from data-centre ranges, use predictable automation User-Agents (including Chrome-Lighthouse strings), lack challenge cookies, and cannot complete managed challenges the way a person with a browser can.
| Path | Typical Cloudflare outcome | What Lighthouse / PageSpeed Insights measures | |---|---|---| | Interactive browser PageSpeed Insights / DevTools | Often allowed after challenge or soft pass | Real HTML and assets (when allowed) | | PageSpeed Insights API / scheduled headless | Challenge interstitial, 403, connection error | Challenge page, error document, or failed fetch | | Monitoring tool from fixed egress IPs | Blocked until IP Access or Skip rule exists | Same failure modes until allowlisted |
When the fetch fails, Google’s tooling often surfaces messages such as ERROREDDOCUMENTREQUEST or a generic connection failure. In Cloudflare Security Events you may see Bot Fight Mode, Super Bot Fight Mode, a WAF custom rule, rate limiting, or Under Attack Mode labelled against the same URL. Treating that as an LCP incident wastes a sprint; treat it as automation that never received the origin HTML.
Agencies also hit a quieter failure: the run “succeeds” but the lab screenshot shows a Cloudflare interstitial or a stripped challenge document. Scores look absurdly bad or oddly empty. Field data in PageSpeed Insights can still look normal when enough real users reach the site, which is another reason not to collapse lab and field into one narrative. For missing URL-level field metrics, see When PageSpeed Insights Shows No CLS or INP for Your URL. For when synthetic and real-user signals should disagree on purpose, see When to Use Synthetic vs Real User Monitoring for Performance.
Several Cloudflare products can interrupt PageSpeed Insights automation. They are not interchangeable, and some cannot be bypassed with the allowlist patterns people copy from blog posts. Matching the failed run to the right product saves a week of rewriting Largest Contentful Paint budgets on a document that never left the edge.
Cloudflare documents that Bot Fight Mode challenges traffic matching known bot patterns and that you cannot bypass or skip it with WAF custom rules or Page Rules, because it does not run on the Ruleset Engine. If portfolio monitoring is blocked and Bot Fight Mode is on, Skip rules aimed at Chrome-Lighthouse will not save you. Cloudflare’s own guidance points teams toward Super Bot Fight Mode when they need exceptions, or toward IP Access rules that match the connecting IP before Bot Fight Mode evaluates the request.
This product adds configurable actions and supports Skip actions in WAF custom rules. It is the practical path when you need to allow verified bots or monitoring User-Agents while still challenging other automated traffic. Misconfigured “Definitely automated” or “Likely automated” actions still catch Lighthouse and PageSpeed Insights traffic that Cloudflare does not classify as a verified bot.
This mode raises friction for almost everyone. Community threads regularly report PageSpeed Insights failing with ERROREDDOCUMENTREQUEST while Under Attack Mode is enabled, even when a User-Agent allowlist appears to match in the logs. Temporary attack posture and continuous performance monitoring do not coexist cleanly unless verified bots (Known Bots) are explicitly skipped from remaining security checks. Under Attack Mode fits active incidents; it is a poor permanent monitoring configuration.
Country blocks, ASN blocks, rate limits, and managed rule sets can 403 Google’s lab infrastructure or your monitoring egress. A rule that challenges “automated” traffic without an earlier Skip for known good bots will catch PageSpeed Insights. Order matters: exceptions for verified bots and monitoring IPs need to run before the block or challenge.
Burst schedules across many URLs on one hostname can trip rate limits even when a single manual test works. Enterprise Bot Management customers can use score fields for finer thresholds; most agency clients on Free or Pro still need coarser Skip / IP Access patterns. When you investigate a Cloudflare block on PageSpeed Insights, open Security Events for the exact timestamp of the failed run, note the Service label, and match it to the product above before you rewrite Largest Contentful Paint budgets. Guessing “CDN is slow” from a challenged document wastes time that belongs in the security configuration, so screenshot the event for the client ticket so the zone admin sees the same evidence you used.
A healthy synthetic run should measure the HTML and assets your visitors receive after Cloudflare’s edge has applied caching and routing, not a challenge interstitial and not a bypass that skips the edge entirely unless that bypass is intentional. Mixing those paths without labels is what makes weekly scores look volatile when nothing in the application changed. Three measurement modes show up in agency work: Edge as users see it. Requests go through Cloudflare with the same security posture as public traffic, except for narrow exceptions for known good lab traffic. This is the default you want for scheduled PageSpeed Insights once allowlists are correct. Challenge / block response. Automation measures Cloudflare’s security HTML or a failed document fetch. Lab metrics are invalid for Core Web Vitals decisions. Report the failure as a monitoring access issue, not as a performance regression. Origin-direct bypass. Some teams point monitors at the origin hostname or an IP Access “grey cloud” path so tests always pass. That can prove origin PHP or application latency, but it is not the same as visitor experience through the CDN. Use it as a diagnostic split, labelled clearly, not as the only portfolio score.
In our experience, the worst client reports skip those labels. One week’s “green” run used a temporary Under Attack exception; the next week’s “red” run hit Bot Fight Mode again. The narrative looks like volatility. The cause is inconsistent access to the document.
Origin and edge stay honest the same way Cache-Control stays honest: name which hostname, which Cloudflare mode, and which allowlist were in effect for the run you are quoting. Pair that with fixed performance budgets so a challenge-induced score does not auto-open a “fix LCP” ticket. Budget templates live in Performance Budget Thresholds Template.
There is no single checkbox labelled “allow PageSpeed Insights forever.” You assemble a small set of exceptions that match how Cloudflare classifies the traffic, then you verify with a scheduled re-run. The patterns below are the ones that usually hold up under Security Events review.
Cloudflare documents custom-rule patterns that allow search-engine and other verified bots using fields such as cf.client.bot (and Bot Management fields where available). User-Agent contains "Chrome-Lighthouse" rules are fragile: they are easy to spoof, easy to miss when Google changes strings, and insufficient under Under Attack Mode when the wrong Skip scope is selected. Known Bots / verified bot Skip rules for remaining WAF modules and Super Bot Fight Mode (where the plan supports them) are a stronger starting point, with monitoring-specific exceptions added only if Security Events still show blocks.