
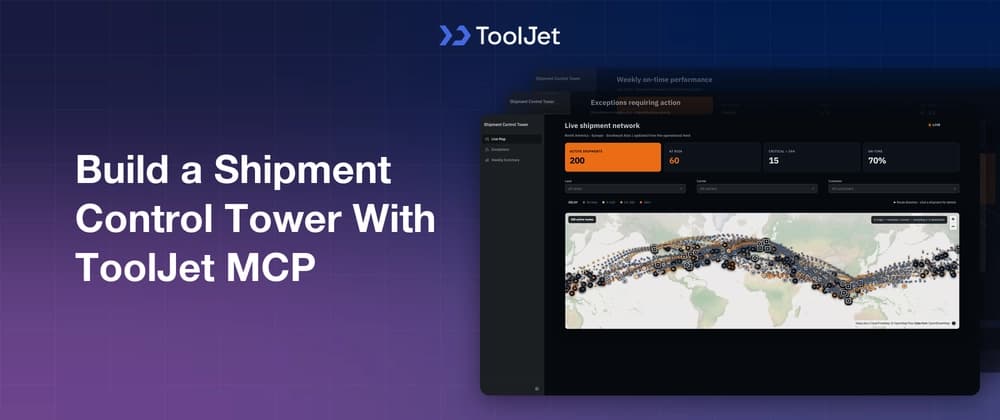
When you build a shipment control tower with ToolJet MCP, freight operations teams get one place to watch shipments, spot delays, and log recovery actions as conditions change, and the result is a structured ToolJet application with data, queries, and interface together, which the team keeps running instead of a screen or a code drop. The app in this article sits at the center of ocean and air freight moving across several lanes, carriers, and customers. You get the live map, the exceptions queue, and the weekly summary, plus the data model and recovery flow that connect them. The article shows how the same app holds the live view, the exception log, and the weekly performance readout in one place.
You can easily build a 4-page app with ToolJet MCP for as little as $0.17 with a lean model (Luna medium), or pay more for the latest flagship reasoning (Sol) if that's what you're after. The cost is your call, not a floor we set for you.
The first page centers a live map, with lane, carrier, and customer filters pinned above it. Each shipment marker changes color with delay severity, and clicking a marker opens a detail panel with lane, carrier, ETA, milestone, and delay. The exceptions page shows only shipments that need attention, so planners work from a queue instead of scanning the whole network. From that page, a planner opens one record, writes a recovery action, and sees the note appear in the history list for that shipment with name and timestamp. The weekly summary pairs KPI tiles with lane and carrier charts, while the dark canvas, tight spacing, and large numbers keep the page readable from a distance. The map stays the focus, but the layout leaves enough room for the operational context around it, including the markers, the summary, and the current exception state. Live map filters narrow shipments by lane, carrier, and customer Marker colour shows delay severity and the detail panel shows the shipment context Exceptions are a working queue for at-risk shipments, not a separate report Recovery actions are logged with author and timestamp for each shipment Weekly summary charts compare on-time performance by lane and carrier
Want to build it yourself? Start with the ToolJet MCP repository for setup instructions, supported agents, and everything you need to follow along.
The build took several passes, and the requirements have been consolidated into one prompt that you could have used from the start. Use the prompt in this article to reproduce the same application in one shot.
Build a 3-page dark command-centre ToolJet app called "Shipment Control Tower" for a freight forwarding company's operations team, moving ocean and air cargo between North America, Europe, and Southeast Asia.
Data model (ToolJet DB): - shipments: shipmentref (unique), mode, lane, carrier, customer, origin, destination, latitude/longitude (current position), scheduledarrival, estimatedarrival, delayhours, riskstatus, milestone, updatedat, weeklabel, ontime. - recoveryactions: shipmentref, actiontext, owneremail, ownername, createdat. Seed shipments with a realistic spread across all combinations of lane (NA→Europe, Europe→NA, SEA→NA, NA→SEA, Europe→SEA, SEA→Europe), carrier (Maersk, MSC, CMA CGM, Lufthansa Cargo, Singapore Airlines Cargo, Kuehne+Nagel Air), and customer (Apex Retail, Nordic Machines, BrightHome, Vela Pharma, Orion Auto, Vertex Electronics), with most shipments on time and a meaningful minority at risk across Watch/At risk/Critical severity.
Page 1 — Live Map: a live map of every shipment, color-coded by how late it is, with filters for lane, carrier, and customer above it. The map must stay smooth with tens of thousands of points (cluster rather than render one DOM element per point). Clicking a shipment shows its full detail (lane, carrier, ETA, milestone, delay).
Page 2 — Exceptions: a list of only the shipments currently at risk (delayhours > 0). A planner can open a shipment and write down what they're doing about it (a free-text recovery action), which is logged with their name and timestamp and shown in a history list for that shipment. Only regional planners and the operations manager may log recovery actions; the customer success team can see everything but change nothing.
Page 3 — Weekly Summary: a simple weekly summary of on-time performance by lane and by carrier, plus headline KPIs (network on-time %, shipment count, late count, average delay).
Design: dark command-centre pattern — near-black background (#070B10), one orange accent colour (#F97316) used for alerts and the active/critical states, generous spacing, and KPI numbers large enough to read from across a room.
MCP works through the whole application, not the screen: the shipment data model, the pages, the components, the queries, and the wiring between them land as one structured ToolJet application. Enterprise app building does not end at the interface, because data connectivity, workflows, permissions, deployment, and ongoing change are the rest of the job, and the generated app sits on a runtime that carries those where supported instead of handing the team a codebase to operate themselves. The path stays open, so you can move from AI generation to visual editing, then drop into code when a rule or a data shape needs it.
A reseed attempt made the shipments table look stuck, but the cause was the protected write path, which refused mutation during test runs, and the browser fallback hit sandbox permissions. The fix was to keep the seeded data and continue through the editor flow the runtime accepted.
The app ended up with three tables. shipments stores the core shipment record and its live position, recoveryactions logs each planner follow-up with author and time, and milestone_events keeps the per-shipment timeline used by the detail panel.
| Page | Components | What they cover | | --- | ---: | --- | | Live Map | 9 | Live route map, KPI tiles, and lane/carrier/customer filters | | Exceptions | 11 | At-risk shipments table, recovery-action modal and history | | Weekly Summary | 12 | KPI tiles and four on-time performance charts |
| Metric | Result | | --- | ---: | | Pages | 3 | | ToolJet DB tables | 3 | | Queries | 6 | | Components | 32 | | Code files to maintain | 0 | | Repair cycles | 1 |
Freight forwarding, 3PL and 4PL logistics, ocean and air carriers, port operators, retail and CPG supply chain, automotive inbound logistics.
Regional planners and the operations manager can log recovery actions on at-risk shipments; the customer success team gets read-only access to the same live map, exceptions queue, and weekly summary.